
May 2024 Owner Rental Housing Market Outlook
Rental Housing Market
Increase in real rent
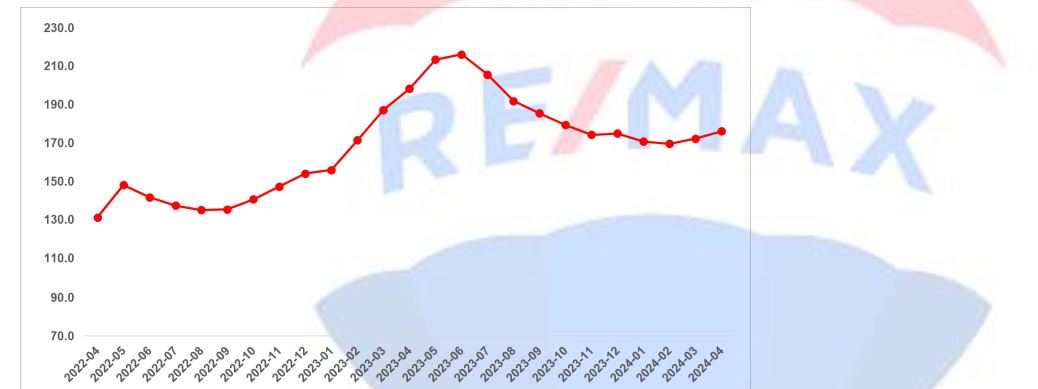
The real rent index across Turkey (2017 September=100) had declined after peaking at 216.2 in June 2023. Contrary to this trend that has marked the last period, average current rental prices increased this month, as in the previous month. The average m2 current rent increased by 5.3 percent from March 2024 to April 2024. As a result of the 3.2 percent increase in CPI in the same period, the real rental price index1 increased by 3.6 points and reached 176.2. Accordingly, the average real rent level across the country is 76.2 percent higher compared to the reference period in September 2017 (Figure 1).
Figure 1: Real rent index across Turkey (2017 Sepül=100)
Source: sahibinden.com, Betam
Real rent three increased in metropolitan cities
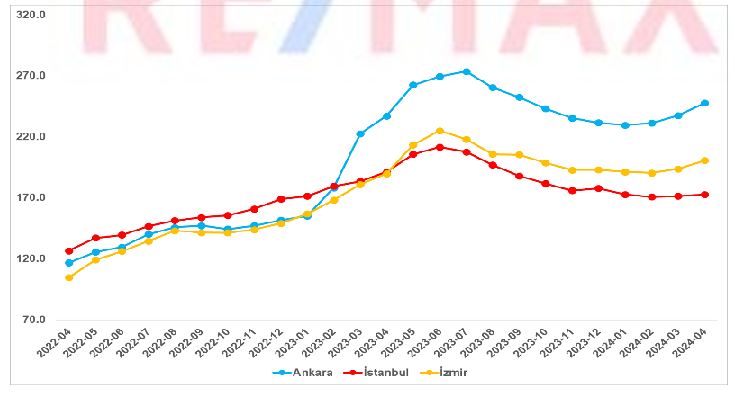
The real rental price index was three percent in April. It also increased in metropolitan cities. While the increase in Istanbul was limited like last month, it was strong in Ankara and Izmir. There were increases. The real rent index was 172.7 in Istanbul, 247.4 in Ankara and 200.4 in Izmir in April. Accordingly, real average rents increased by 72.7 percent in Istanbul, 147.4 percent in Ankara and 100.4 percent in Izmir compared to our reference period of September 2017. is high (Figure 2).
Figure 2: Three real rent index in major cities (2017 Sepül=100)
Source: sahibinden.com, Betam
1Real prices are calculated based on September 2017. The fact that this value is greater than (smaller than) 100 indicates that real rental prices have increased (decreased) compared to the reference period.
Annual change in real rent is in the negative area
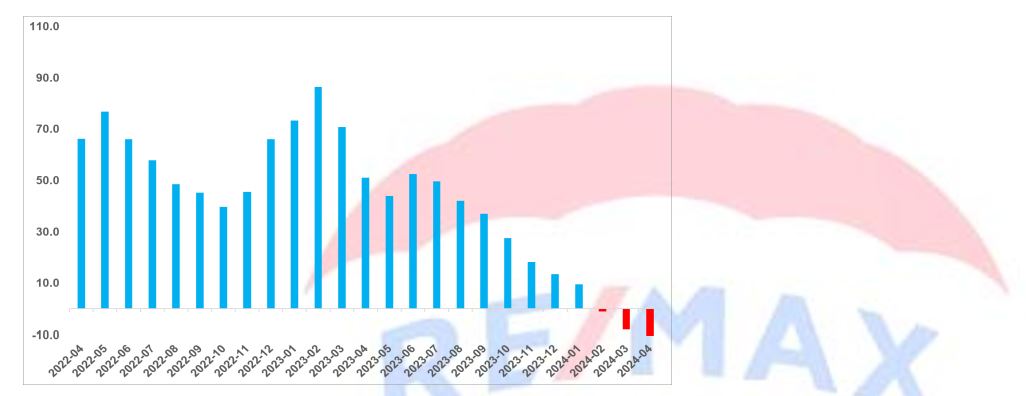
Annual change rates in inflation-adjusted (real) rent throughout Turkey have been decreasing for a long time. Except for the exceptional increase from May to June last year, the annual rate of change in average real rent had started to decline after peaking at 86.6 percent in February 2023. The annual real rental price change, which gave way to negative increases as of February 2024, was minus 11.2 percent in April. In other words, real rents are 11.2 percent lower on average compared to the same month of the previous year.
Figure 3: Annual change in Turkey's real rental prices (%)
Source: sahibinden.com, Betam
Annual change in real rent decreases in Istanbul, increases in Ankara and Izmir
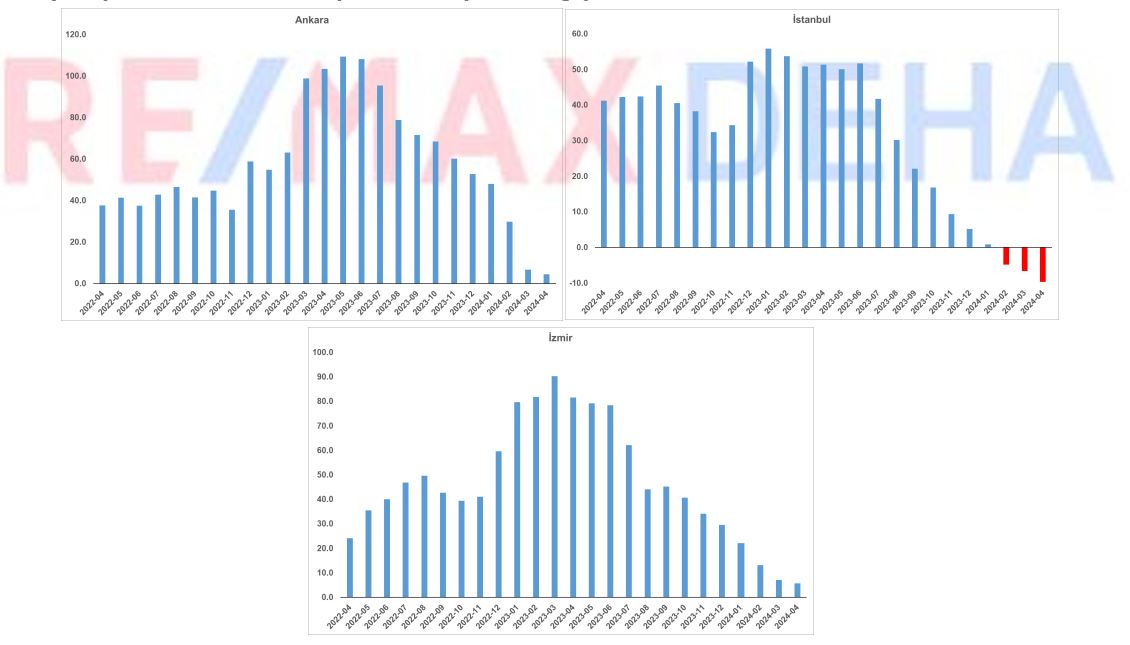
Annual real rent increases have increased in Istanbul from January 2023 (peak 55.8 percent), in Izmir from March (peak 90.3 percent) and in Ankara from May with the delay caused by the earthquake (peak 109 percent). ,3) is decreasing. (Figure 4). The real rent increase, which went into negative territory on an annual basis in Istanbul, approached a halt in Ankara and Izmir. The annual real rent increase, which was 6.7 percent in Ankara in March, was 4.4 percent this month. The annual real rent increase in Izmir, which was 7.1 percent in March, was 5.7 percent in April. In Istanbul, real rent, which decreased by 6.6 percent on an annual basis in March, decreased by 9.7 percent in April. We can say that this situation indicates that purchasing a house to earn rental income is no longer an attractive investment alternative.
Figure 4: Three Annual change in real rental prices in major cities (%)
Source: sahibinden.com, Betam
The increase in current rental prices continues to slow down
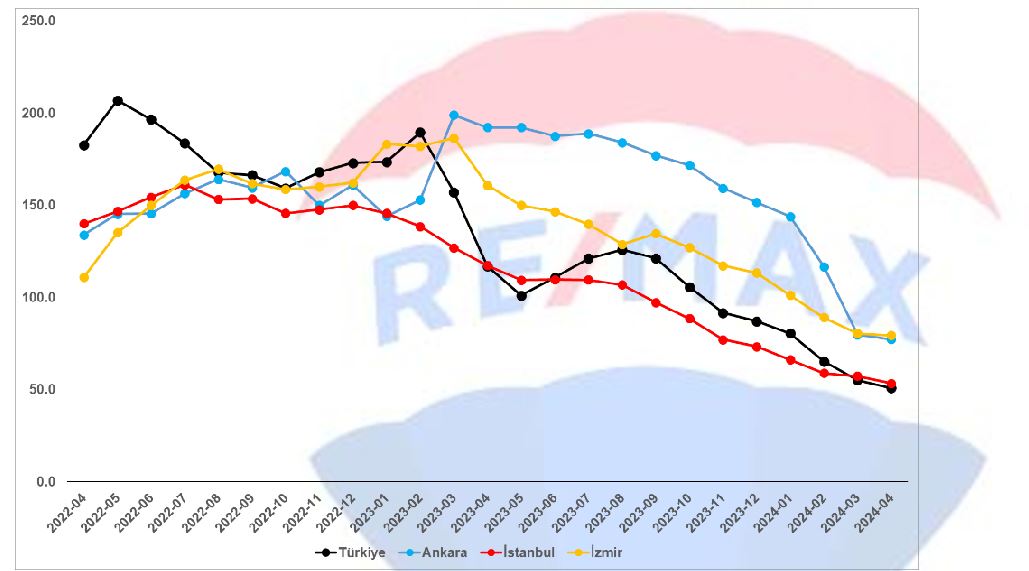
The annual change in current rental prices across Turkey increased slightly in August after decreasing from March to July. However, the annual rate of change of rental prices has been decreasing since September. The annual rate of change in rental prices, which was 55.1 percent in March 2024, decreased to 50.8 percent in April 2024 (Figure 5). The current average m2 rental price in Turkey, which was 105 TL in April last year, is 158.6 TL in April 2024.
Şekil 5: Türkiye ve üç büyük ilde bir önceki yılın aynı ayına göre cari kira fiyatı değişimi (%)
Source: sahibinden.com, Betam
Slowdown in current rent increases threefold; It continues in big cities too
The annual change rates in m2 prices for rent are three; It decreased in metropolitan cities. The annual current rental price change rate from March to April increased from 57.3 percent to 53.3 percent in Istanbul, from 79.8 percent to 77.3 percent in Ankara, and from 79.8 percent to 77.3 percent in Izmir. in percent It decreased from 80.5 percent to 79.4 percent (Figure 5). Average rental housing advertised m2 prices are 200 TL in Istanbul, 150 TL in Ankara, and 179 TL in Izmir.
Variation in annual rent increases in metropolitan cities
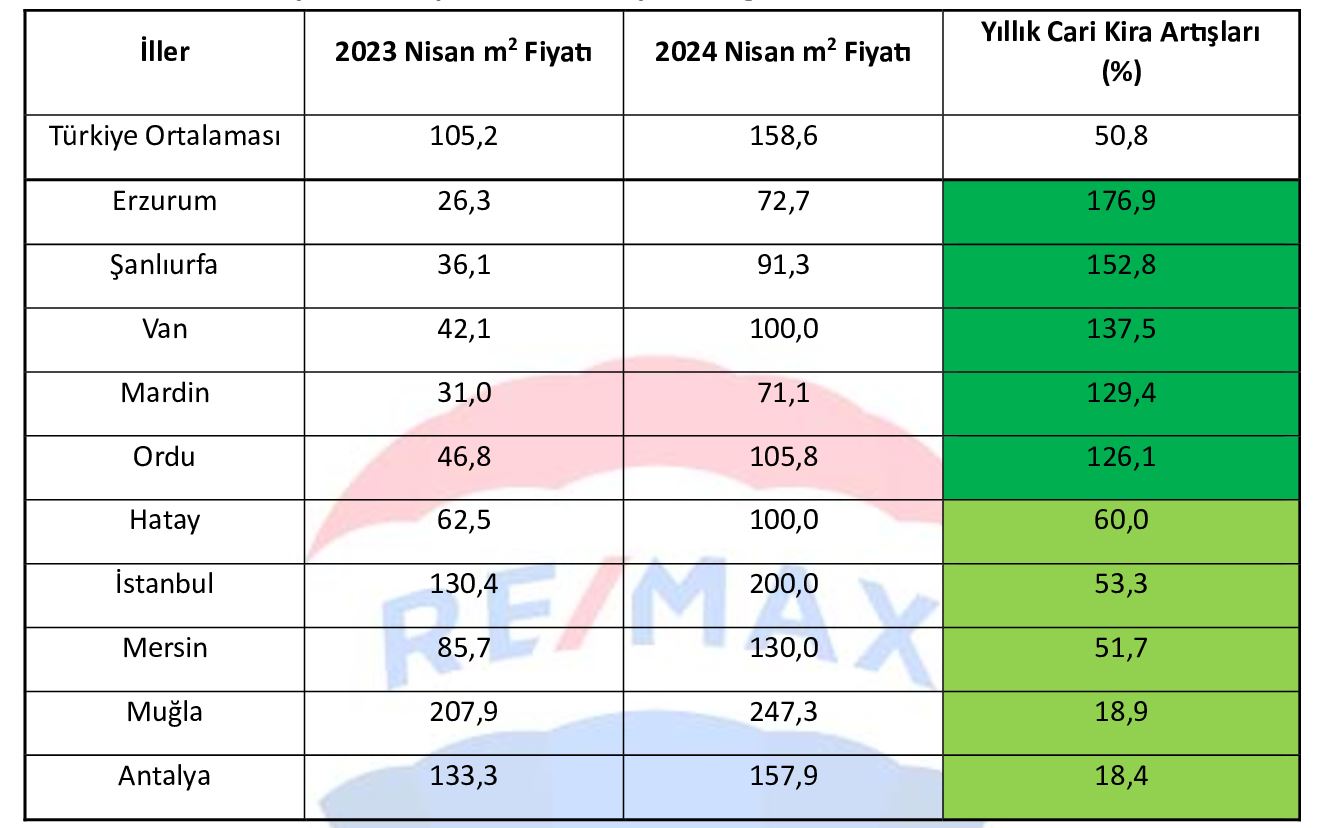
While the annual average current rent increase in April was 50.8 percent across the country, current rent increase rates in metropolitan cities vary (Table 1). The provinces with the highest price increase: Erzurum (176.9 percent), Şanlıurfa (152.8 percent), Van (137.5 percent), Mardin (129 percent, 4) and Ordu (percentage 126.1). The area with the lowest rent increase Provinces: Hatay (60 percent), Istanbul (53.3 percent), Mersin (51.7 percent), Muğla (18.9 percent) and Antalya (18.4 percent) . According to April data, the annual rental price increase rate in these five cities is lower than the annual CPI inflation rate (69.8 percent). Therefore, it can be said that purchasing a house to earn rental income is no longer an attractive investment alternative in these provinces. .
Table 1: Provinces with the highest and lowest annual rent increases – April 2024
Source: sahibinden.com, Betam
Decline in rental housing supply
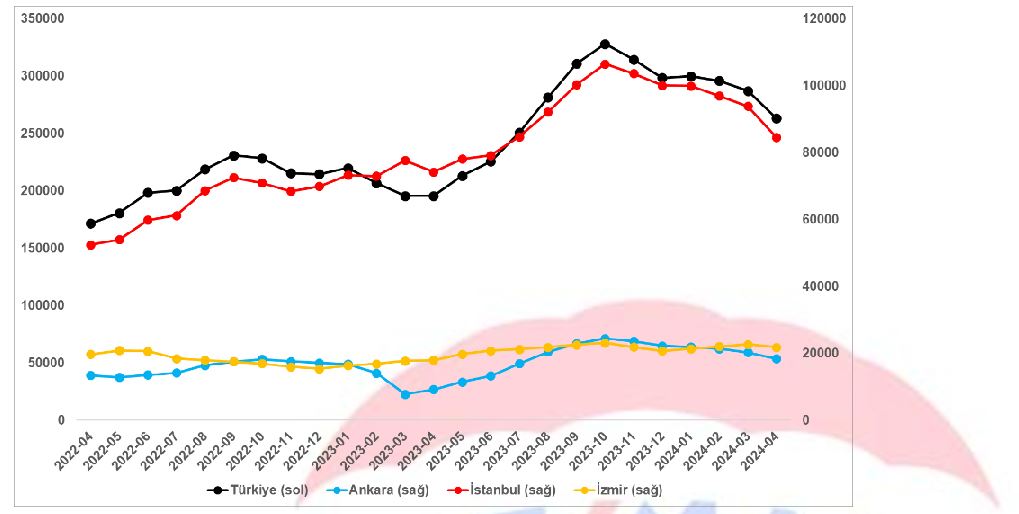
Figure 6 shows across the country and three The size of the rental housing supply in a metropolitan city. It shows the course of the number of rental advertisements we use. In the period October-December 2023, across the country and three years ago. The decline in the number of rental housing advertisements in the major province seemed to have stopped in January 2024. In February, the number of advertisements decreased both in Turkey and in Istanbul and Ankara. The downward trend is evident both in the country and in the third quarter. It continues in the metropolitan city. From March 2024 to April 2024, the number of advertisements increased by 8.3 percent across the country (from 286,936 to 262,991), and by 10.5 percent in Istanbul (from 93,844 to 84,454). , It decreased by 9.7 percent (from 20,270 to 18,392) in Ankara and by 3.9 percent (from 22,681 to 21,808) in Izmir.
Figure 6: Turkey and Turkey Number of rental advertisements per major city (number)
Source: sahibinden.com, Betam
Demand for rental housing increased
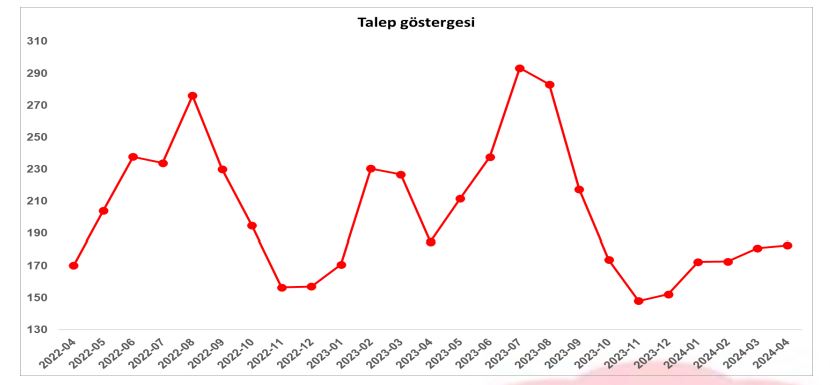
Figure 7 shows the course of rental housing demand across the country. The rental housing demand indicator was created by combining 6 different data. These data; Number of views of advertisements, number of times advertisements were added to favorites, total number of messages sent to advertisement owners, total number of phone calls made through sahibinden.com application, rental numbers on sahibinden.com mobile and web platforms obtained from Google Analytics. It consists of the number of users and page views for the real estate category and the relevant month.
While creating the rental housing demand indicator, the values of these series in February 2020 were individually equalized to 100, and the values in other months were calculated accordingly. Then, the value of the new demand indicator in the relevant month was calculated by taking the weighted average of these indicators. An increase in this indicator indicates that the housing demand has increased, and a decrease indicates that the housing demand has decreased. The amount of increase or decrease in the demand indicator provides information about how much housing demand has changed.
An important feature of the demand in the rental housing market is that it is open to seasonal effects. The seasonal effect is clearly observed in Figure 7: The demand, which increases between April and September, decreases in the following months and remains relatively stable in the winter months. It can be thought that those who moved provinces by appointment and university students were influential in this increase in the demand for rental housing in the spring and summer months. For this reason, seasonal effects should be taken into account when interpreting changes in the demand indicator.
While the rental housing demand indicator decreased between August and November, it started to trend towards a slight increase after December. In April, the rental housing demand index increased by 1 percent (from 181 to 182.8). When we look at it on an annual basis, there is a 1 percent decrease in the demand for rental housing.
Figure 7: Demand indicator (February 2020=100)
Source: sahibinden.com, Betam
Both the number of rental advertisements and the number of houses rented have decreased throughout Turkey.
Figure 8-left panel shows the ratio of the number of rented houses to the number of rental advertisements3, which shows how much of the rental advertisements are rented. This rate, which decreased in the second half of 2023, has been increasing with small movements since the beginning of 2024. There is a 0.5 percentage point increase in the ratio of the number of rented houses to the number of rental advertisements in April (from 15.1 percent to 15.6 percent). However, this increase should not be considered as a sign of revival in the rental housing market. Because both the number of houses rented and the number of rental advertisements decreased in April. While the number of rental houses decreased by 8.3 percent (from 286,936 to 262,991), the number of rented houses decreased by 5.2 percent (from 43,332 to 41,094). The decrease in the number of advertisements more than the number of rented houses caused the rate to increase.
Figure 8: Ratio of the number of rented houses to the number of rental house advertisements throughout Turkey (%) (left panel), number of rented and leased houses (Thousand) (right panel)

Source: sahibinden.com, Betam
While the number of rented houses increased in Istanbul and Ankara, it decreased in Izmir.
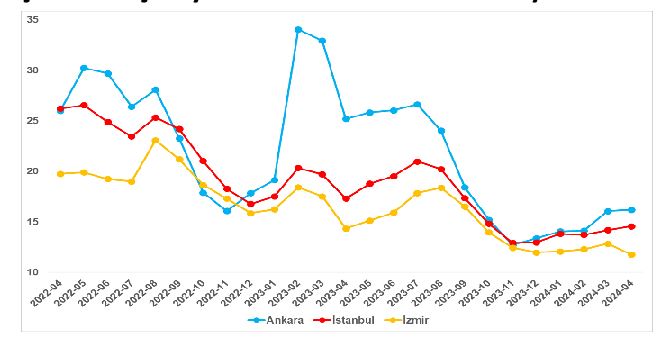
While the ratio of the number of rented houses to the number of rental advertisements increased in Istanbul and Ankara, it decreased in Izmir (Figure 9). This rate increased by 0.1 percentage points in Ankara and 0.4 percentage points in Istanbul from March to April. In Izmir, it decreased by 1.1 percentage points. Thus, the ratio of the number of rented houses to the number of rental advertisements was 14.6 percent in Istanbul, 16.2 percent in Ankara and 11.8 percent in Izmir.
Figure 9: Three Ratio of the number of rental houses to the number of rental housing advertisements in the largest city (%)
Source: sahibinden.com, Betam
There is a three-fold increase in the number of rental advertisements and rented houses. decline in big cities
From March 2024 to April 2024, the number of advertisements increased by 8.3 percent across the country (from 286,936 to 262,991), by 10 percent in Istanbul (from 93,844 to 84,454), It decreased by 9.3 percent (from 20,270 to 18,392) in Ankara and by 3.8 percent (from 22,681 to 21,808) in Izmir. The number of rented houses increased by 7.5 percent in Istanbul (from 13,300 to 12,304), by 8.5 percent in Ankara (from 3,255 to 2,977), and by 10 percent in Izmir. 11.9 It decreased (from 2.909 to 2.563).
Figure 10: Three Number of rental and rented houses in the largest city (thousand units)

Source: sahibinden.com, Betam
The rental ad age continues to increase
Rental housing closed advertisement age4 sums the duration of the rental housing advertisements closed by the user in the relevant month and divides it by the number of unique advertisements closed by the user in that month. Therefore, this number represents the average number of advertisements. It shows that it has been on air for days. The age at which the rental house is closed is another measure of how easy or difficult it is to rent the house to be rented. It should be considered as. An increase in this indicator indicates that houses are advertised for a longer time and are rented more difficult or slowly, while the opposite indicates that houses are rented easier or faster.
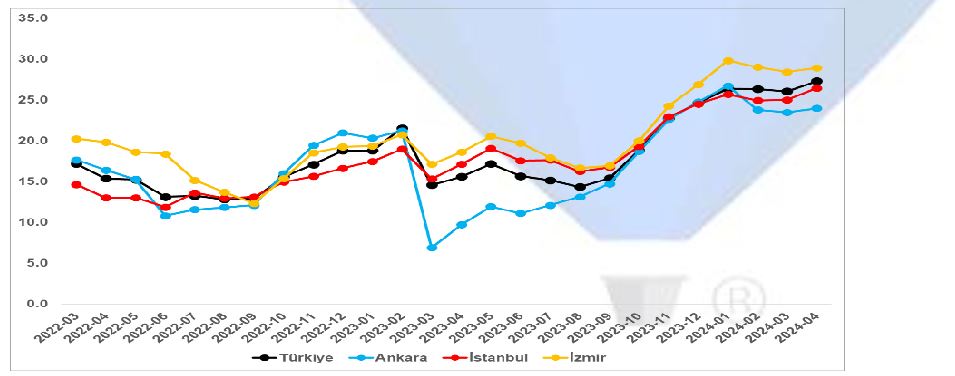
Figure 11 shows the age of rental housing closures across the country and three years. It shows its course in the big province. The age of closed advertisements increased by 1.3 days across the country compared to the previous month and reached 27.3 days. The age of closed advertisements increased by 1.4 days in Istanbul to 26.4 days, in Ankara by 0.5 days to 24 days, and in Izmir by 0.5 days to 28.9 days. ;n happened.
Figure 11: Age at which rental housing is closed (Days)
Source: sahibinden.com, Betam
Difference in rental advertisement ages in metropolitan cities
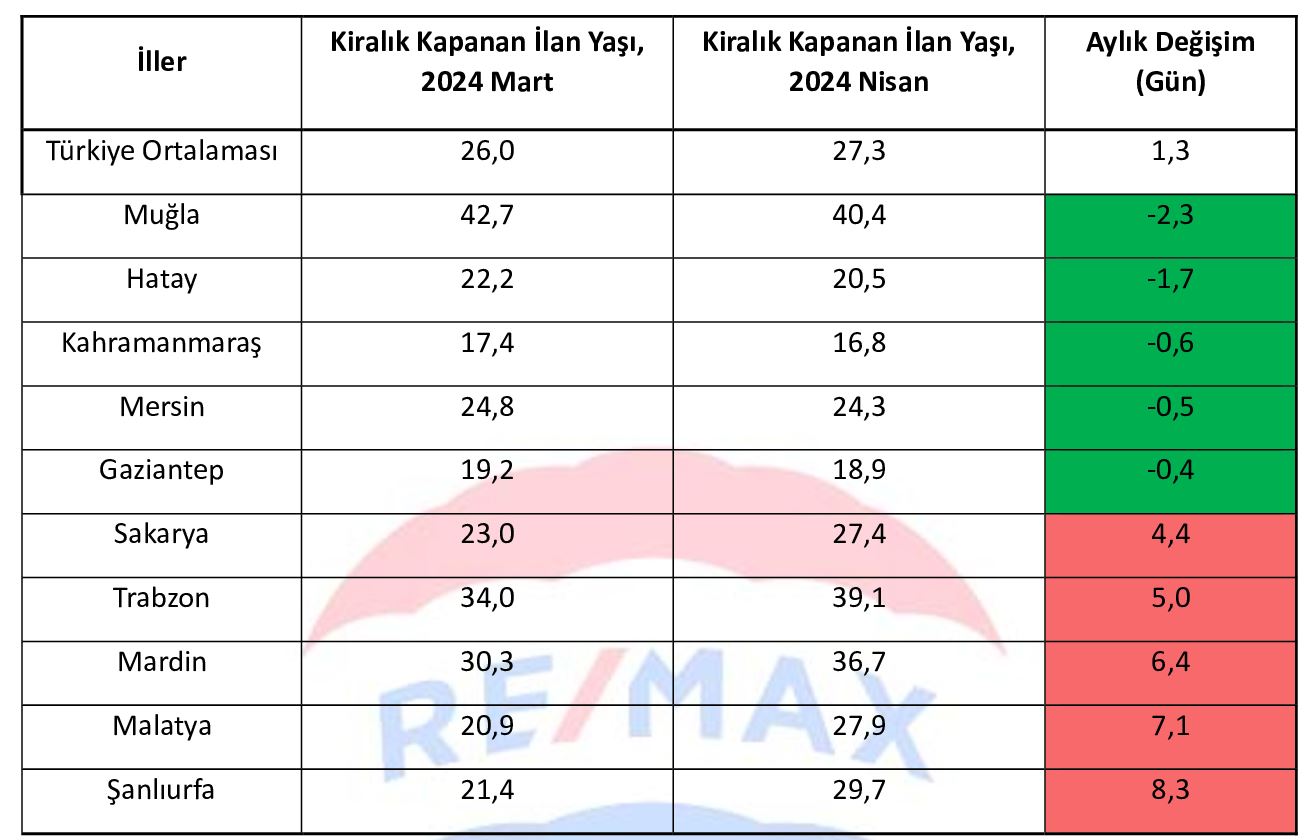
Table 2 shows the 10 provinces where the age of closed rental advertisements increased the most and decreased the most compared to the previous month. According to April data, the provinces where the rental advertisement age decreased the most: Muğla (2.3 days), Hatay (1.7 days), Kahramanmaraş (0.6 days), Mersin (0, 5 days) and Gaziantep (0.4 days). The provinces where the rental advertisement age increased the most are Sakarya (4.4 days), Trabzon (5 days), Mardin (6.4 days), Malatya (7.1 days) and Sakarya. (8.3 days).
Table 2: Provinces where the age of rental housing closures increased and decreased most rapidly compared to the previous month – April 2024
Source: sahibinden.com, Betam


 I Want to Sell/Rent My Property
 Looking for a Property for Sale/Rent
 I Want Portfolio/Buyer Referral Business Partnership
 Call Now