
1st Quarter January - March Building Permit Statistics
Building Permit Statistics, 1st quarter: January-March, 2024
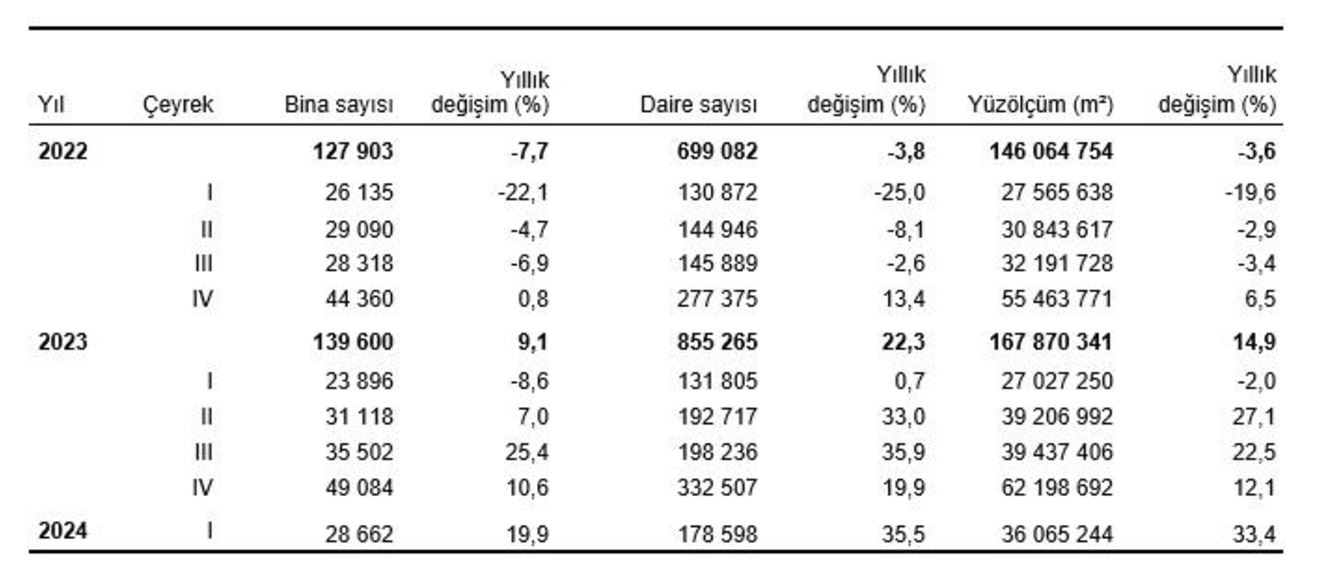
Surface measurement of buildings for which building permits have been issued. increased by 33.4%
Compared to the same quarter of the previous year, the number of buildings issued with building permits by municipalities in the first quarter of 2024 is 19.9%, the number of flats is 35.5% and the surface area is 33%. increased by .4.
Number of flats and surface area of buildings with building permits, 1st Quarter 2024
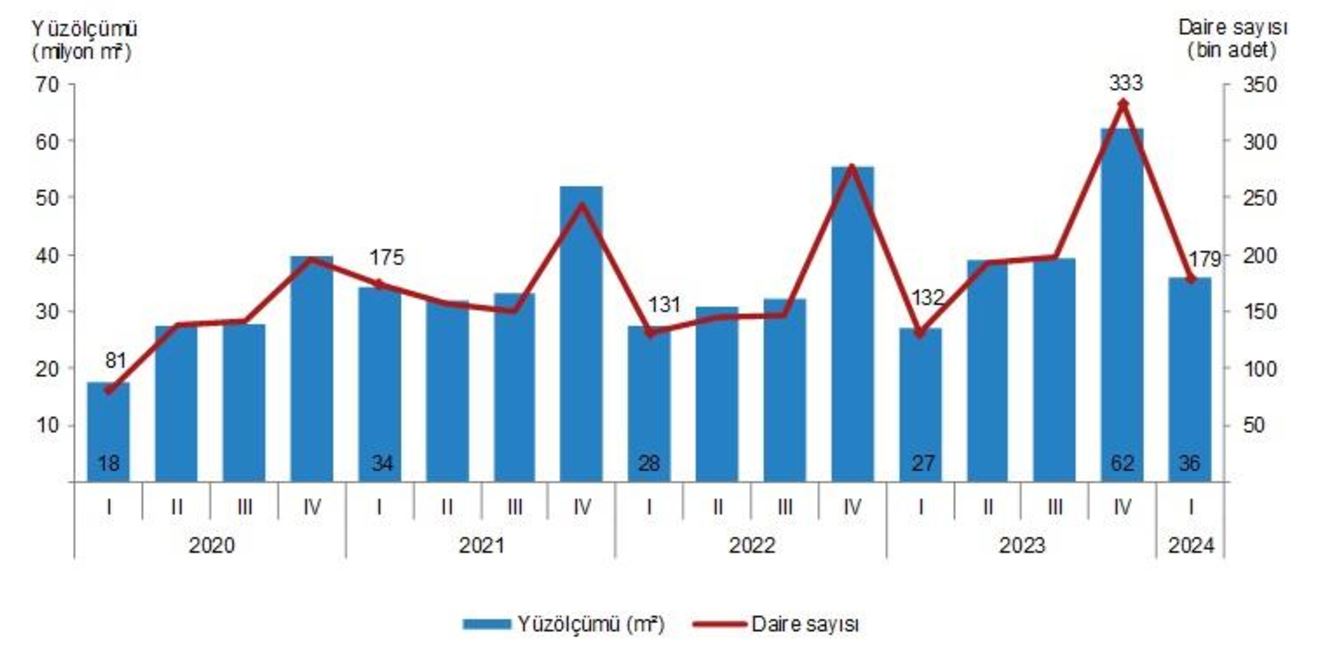
Building permit statistics, 2022-2024
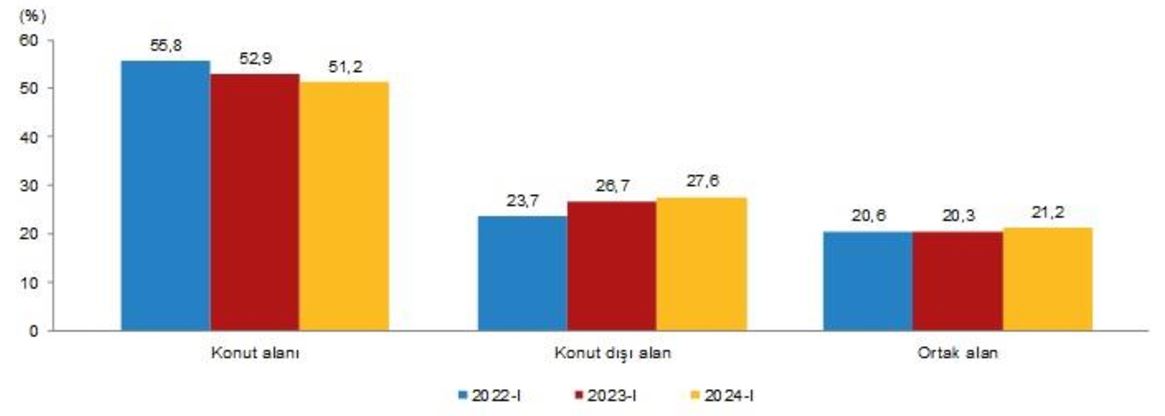
51.2% of the total surface area was realized as residential area
Total surface area of buildings for which building permits were issued by municipalities in the first quarter of 2024. 36.1 million m² while; Of this, 18.5 million square meters were residential, 10.0 million square meters were non-residential and 7.6 million square meters were common use areas.
Surface shares of residential, non-residential and common areas according to building permit, 1st Quarter, 2022-2024
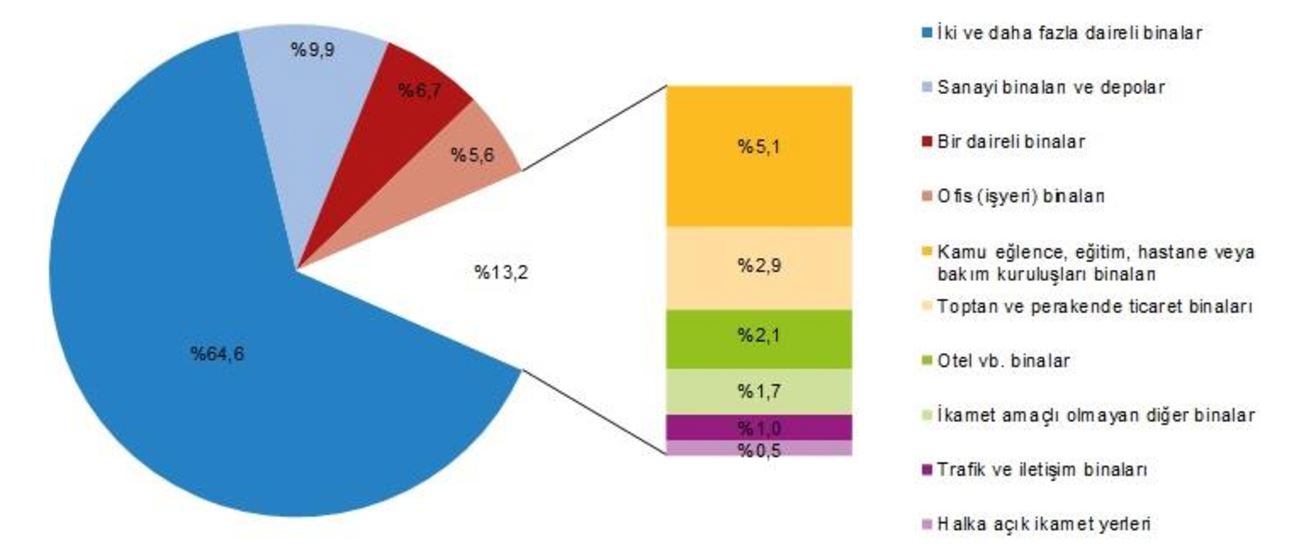
The highest surface area share was in buildings with two or more flats, with 64.6%
According to the purpose of use of the buildings for which building permits were issued by the municipalities in the first quarter of 2024, the highest surface area share is 23.3 million m² and residential buildings with two or more flats. This is followed by 3.6 million m² followed by industrial buildings and warehouses.
The surface area of the buildings for which construction permits are given is measured according to their intended use. shares, 1st quarter 2024
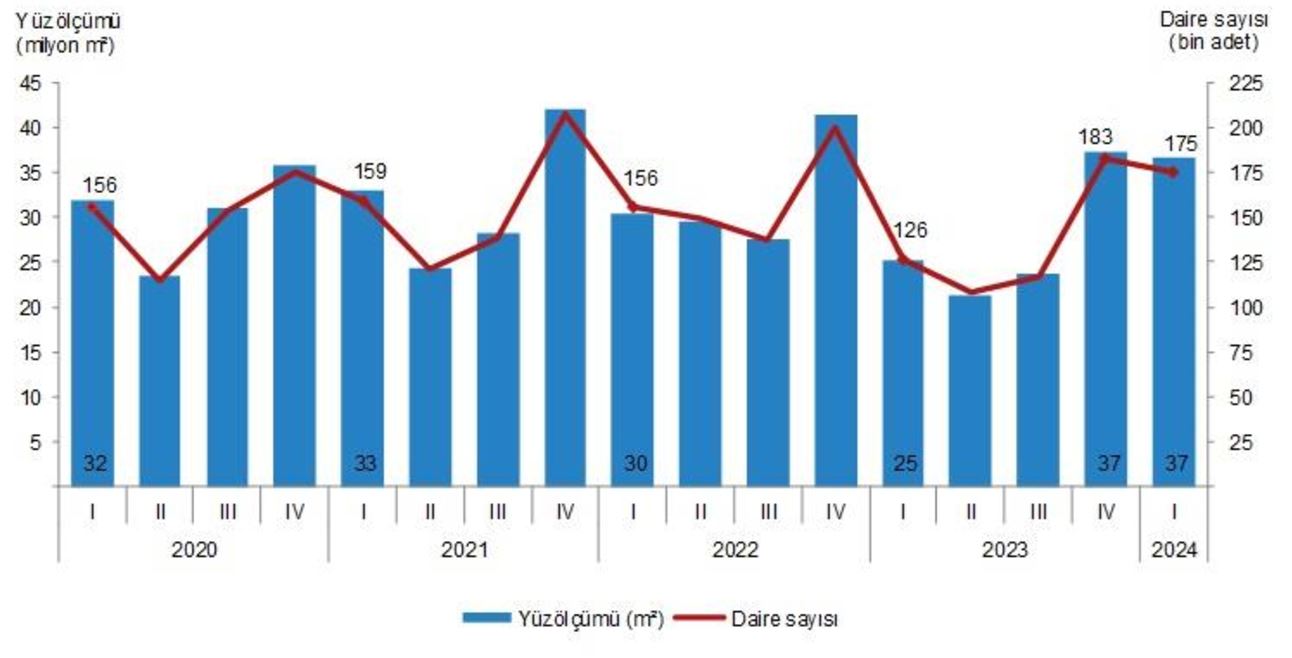
Surface measurement of buildings for which building occupancy permits are issued. increased by 45.3%
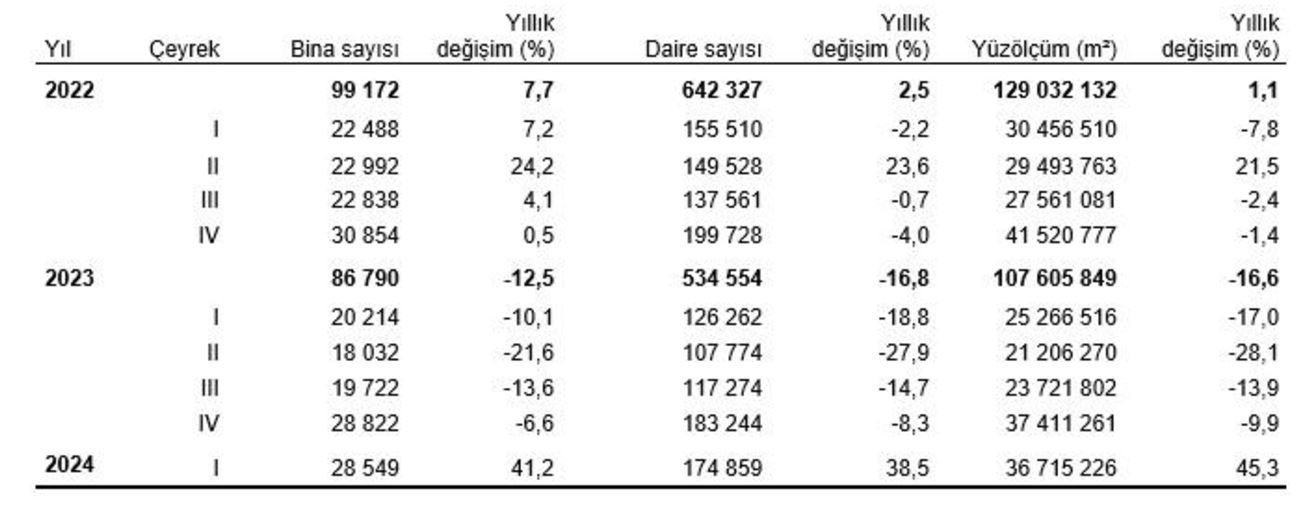
Compared to the same quarter of the previous year, the number of buildings issued with building permits by municipalities in the first quarter of 2024 was 41.2%, the number of flats was 38.5% and the surface area was 41.2%. increased by 45.3%.
Number of flats and surface area of buildings with building permits, 1st Quarter 2024
Building occupancy permit statistics, 2022-2024
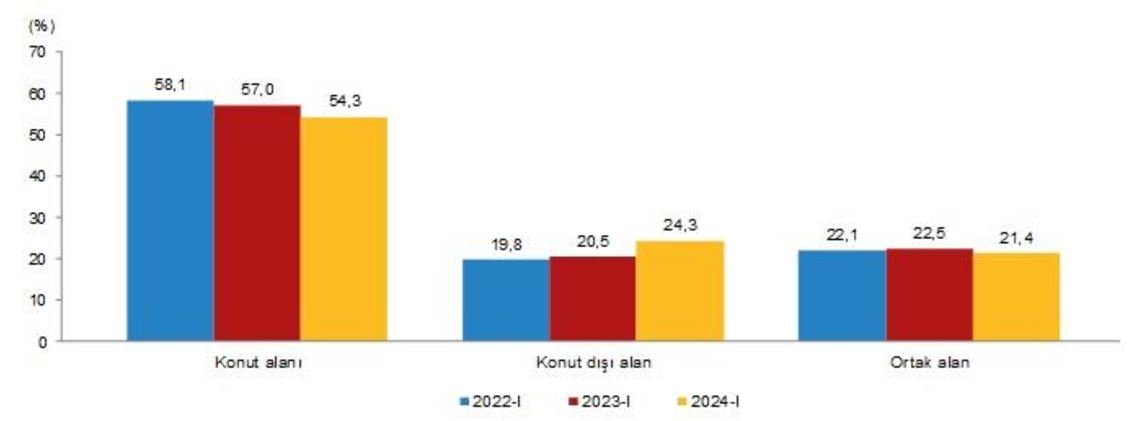
54.3% of the total surface area. realized as a residential area
Total surface area of the buildings for which occupancy permits were issued by the municipalities in the first quarter of 2024. 36.7 million m² while; Of this, 19.9 million square meters were residential, 8.9 million square meters were non-residential and 7.9 million square meters were common areas.
Floating of residential, non-residential and common areas according to the building occupancy permit. shares, 1st quarter, 2022-2024
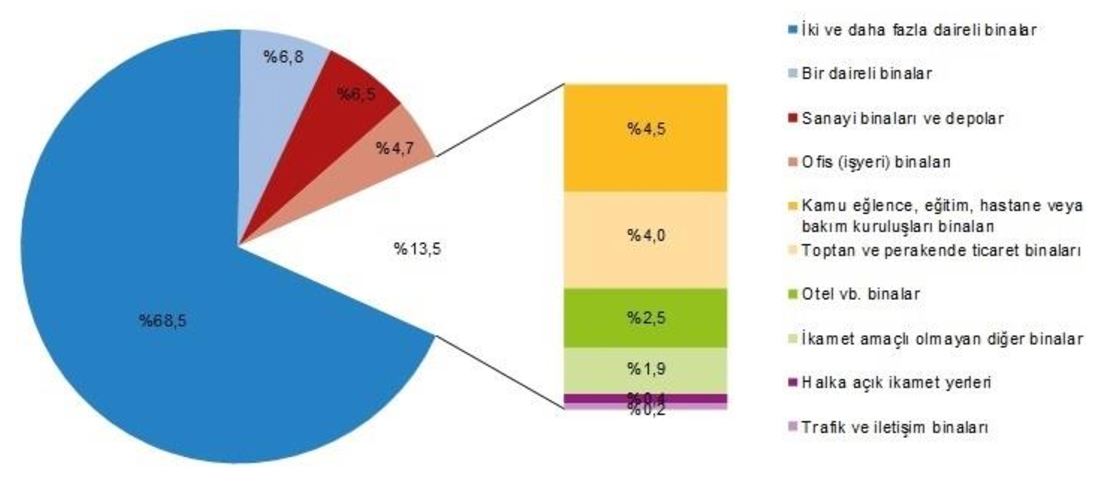
The highest surface area share was in buildings with two or more flats, with 68.5%
According to the purpose of use of the buildings for which occupancy permits were issued by the municipalities in the first quarter of 2024, the highest surface area share is 25.2 million m² and residential buildings with two or more flats. This is followed by 2.5 million m² followed by buildings with one flat.
The surface area of the buildings for which a building occupancy permit is issued is measured according to their intended use. shares, 1st quarter 2024
Source:TÜİK


 I Want to Sell/Rent My Property
 Looking for a Property for Sale/Rent
 I Want Portfolio/Buyer Referral Business Partnership
 Call Now